Figure 9.

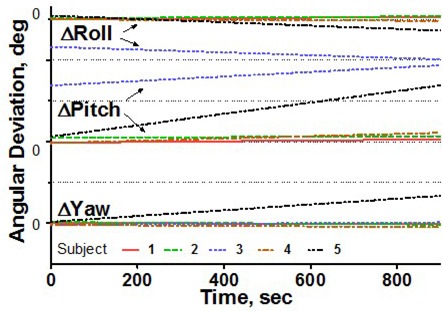
Linear regression of rotational head displacements from the baseline for all subjects, 15‐minute treatment simulation. Dotted grid lines correspond to 1‐degree intervals.

Linear regression of rotational head displacements from the baseline for all subjects, 15‐minute treatment simulation. Dotted grid lines correspond to 1‐degree intervals.