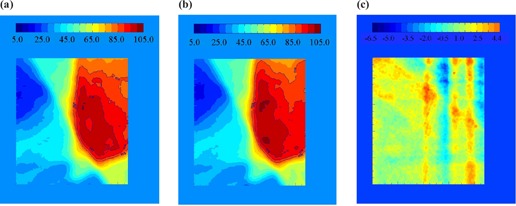
Figure 3. (a) and (b) show for two different samples of initial motion phases, {μ}, of the platform. Subtracted from each other, (c) shows an example of the possible changes of the daily distribution delivered when motion is present. The values in this example range from to of the total prescribed dose.