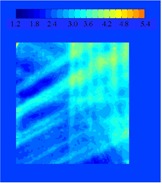
Figure 4. A plot of the value of the standard deviation (1σ) of at each point in the array after 1000 trials of randomly selected motion phases. The values of the standard deviation range from 1.2% to 5.4%. Within the high‐dose region (90% isodose curve), the variation is 2.0% to 3.8%.

