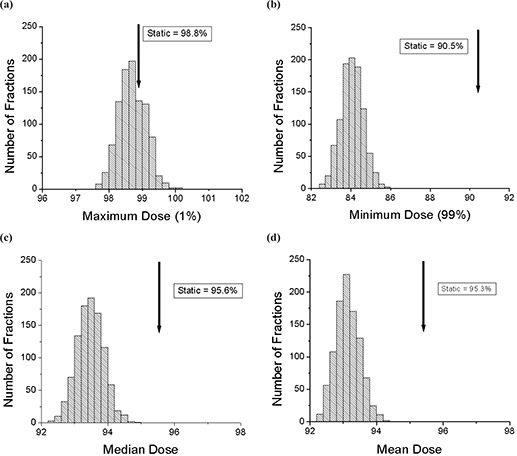
Figure 10. The histograms for 1000 trials of 30‐fraction treatments with motion. All the values are calculated within the region of interest (static 90% isodose curve). (a) The maximum (99th percentile) dose is shown along with the static value. (b) The minimum (1st percentile) dose is shown along with the static value. (c) The median dose is shown along with the static value. (d) The mean dose is shown along with the static value.

