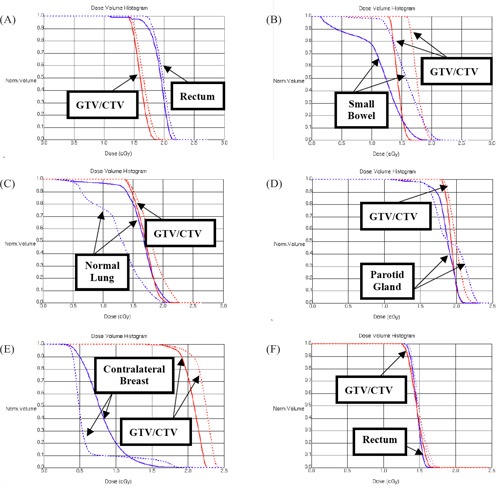
Figure 4.

The dose–volume histogram (DVH) of tumor [gross tumor volume (GTV) / clinical tumor volume (CTV)] and all critical organs is evaluated in various treatment sites—(A) pelvis, (B) abdomen, (C) lung, (D) head and neck, (E) breast, and (F) prostate—using megavoltage cone‐beam computed tomography images (solid line) and orthogonal portal images (dashed line) at the same monitor unit value (2 MUs total).
