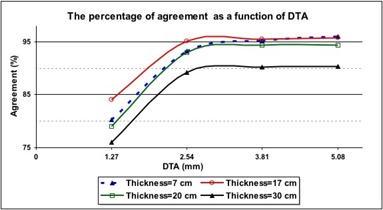
Figure 9.

The percentage agreement between relative dose values calculated using the treatment planning system (TPS) and those measured using an electronic portal imaging device [EPID—after application of a correction factor matrix (CFM)] versus distance to agreement (DTA) for an inhomogeneous phantom of various thicknesses. The was 2.5% in all cases
