
Figure 7.
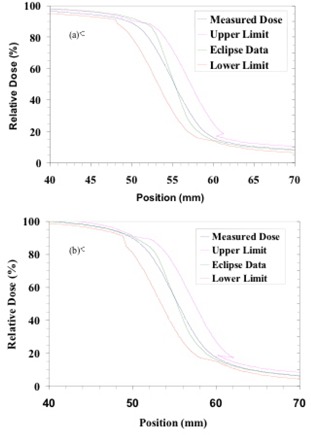
Graphs showing the penumbra portions of measured (blue) and calculated (green) profiles in (a) 6‐MV and (b) 15‐MV beams at 10 cm depth for a ‐cm field. The other two curves in these graphs indicate the lower (red) and upper (magenta) limits according to penumbra criteria given in Table 2. Notice that the Eclipse data show a steeper penumbra than do the measured profiles at both energies. This general trend was observed at the other depths investigated in the present study.