
Figure 8.
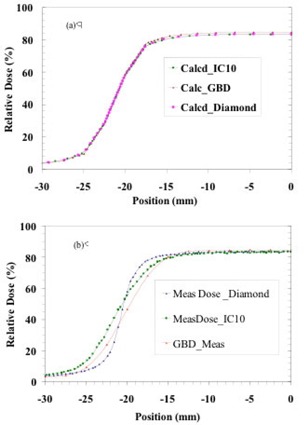
The description of (a) calculated and (b) measured penumbrae of a ‐cm field is shown for three different cases: using a diamond detector; using an CC13 chamber; and data present in the AAA beam configuration denoted as GBD. The calculated data in the upper‐panel curves are obtained from Eclipse after the AAA is configured with the data measured by various detectors. The insensitivity of the modeled penumbra to the measured penumbra is clearly visible in (a). All curves show percentage dose relative to a ‐cm field at maximum dose .