Figure 1.

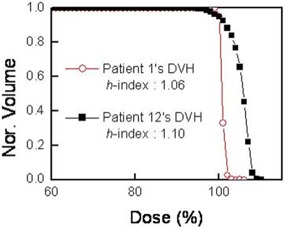
Apair of real patient dose‐volume histograms (DVHs) with conventional homogeneity indices (H‐indices) of 1.06 and 1.10. The normalized volume (Nor. Volume) in the y‐axis represents the fraction of the total volume V.

Apair of real patient dose‐volume histograms (DVHs) with conventional homogeneity indices (H‐indices) of 1.06 and 1.10. The normalized volume (Nor. Volume) in the y‐axis represents the fraction of the total volume V.