
Figure 2.
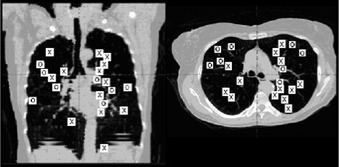
Coronal (left) and axial (right) composite locations of planning target volumes treated. Those marked with an X are lesions for which recalculation of the equivalent uniform dose without inhomogeneous correction (IC) differed by more than 15% from the value obtained with IC; for those marked with an O, the difference was less than 15%. See Results section for additional explanation.