
Figure 5.
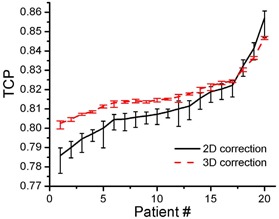
TCP graph showing mean values for 2D correction and potentially 3D full correction with the 95% confidence limits for the 20 patients
Official websites use .gov
A
.gov website belongs to an official
government organization in the United States.
Secure .gov websites use HTTPS
A lock (
) or https:// means you've safely
connected to the .gov website. Share sensitive
information only on official, secure websites.
TCP graph showing mean values for 2D correction and potentially 3D full correction with the 95% confidence limits for the 20 patients