
Figure 6.
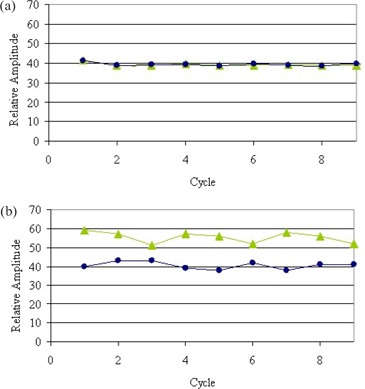
Comparison of (a) percentage amplitude and (b) percentage time gating methods on the 30% and 70% phase sets only, showing the phase location over nine cycles on a nonperiodic, constant amplitude motion pattern. These plots demonstrate the effect of inhale and exhale slope changes on phase location.