Figure 5.

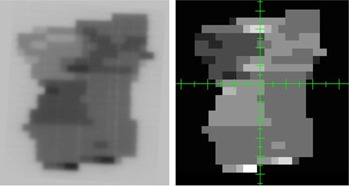
Comparison of a calculated intensity map (right) with the measured fluence map (left) for a head/neck patient. Note that high intensity (lighter pixels in the intensity map) corresponds to darker exposure on the film.

Comparison of a calculated intensity map (right) with the measured fluence map (left) for a head/neck patient. Note that high intensity (lighter pixels in the intensity map) corresponds to darker exposure on the film.