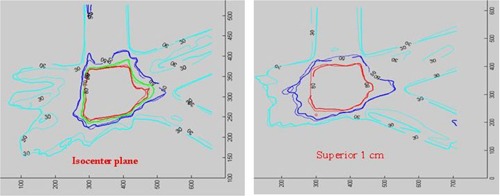
Figure 8.

Isodose distribution comparison for a head/neck noncoplanar IMRT plan. Isodose lines of 80%, 70%, 50%, and 30% are shown in the isocenter plane (left), while only 80%, 50%, and 30% isodose lines are shown in the plane 1 cm superior to the isocenter (right).
