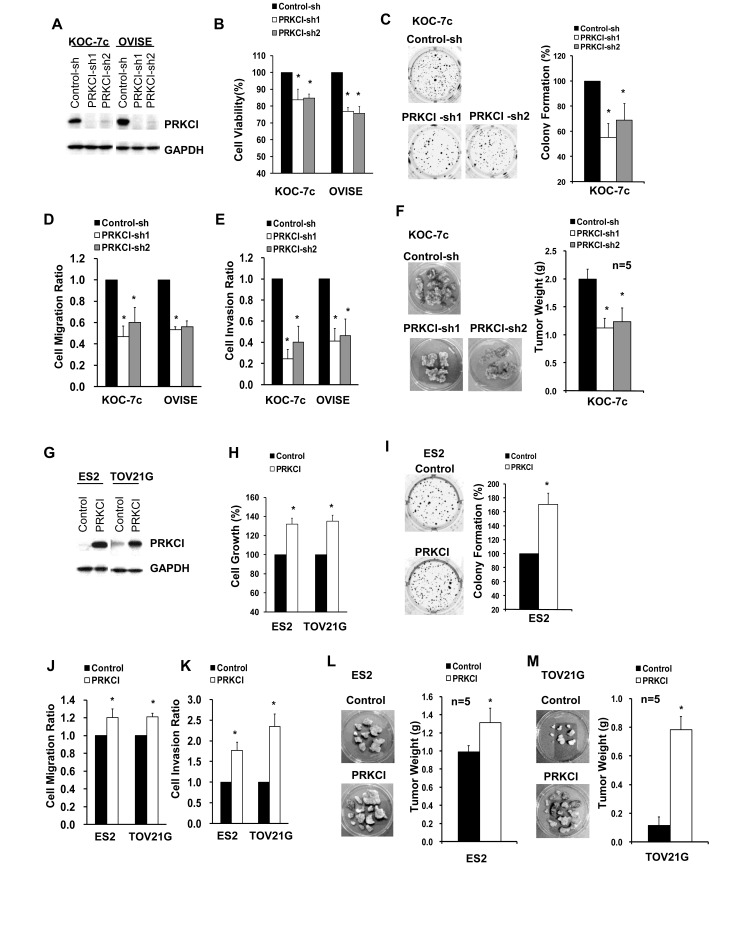
Figure 3. Oncogenic function of PRKCI in vitro and in vivo.
A. Western blot analysis for PRKCI protein levels in stable PRKCI-knockdown cell lines (KOC-7c and OVISE cells). The stable PRKCI-knockdown cells were tested for B. cell viability by CellTiter Blue cell viability assay, C. anchorage-independent growth by soft-agar colony formation assay and D.-E. cell migration and invasion ability by transwell-based cell migration and invasion assays. F. The cells were intraperitoneally injected into athymic nude mice (5 mice per group). The mice were allowed to grow for 3-6 weeks. After that, xenograft tumor samples were collected and average tumor weight of different groups of mice were measured. G. Western blot analysis for PRKCI protein levels in stable PRKCI-overexpressing cell lines (ES2 and TOV21G cells). The stable PRKCI-overexpressing cells were tested for H. cell growth by CellTiter Blue cell viability assay, I. anchorage-independent growth by soft-agar colony formation assay and J.-K. cell migration and invasion ability by transwell-based cell migration and invasion assays. L. The cells were intraperitoneally injected into athymic nude mice (5 mice per group). The mice were allowed to grow for 3-6 weeks. After that, xenograft tumor samples were collected and average tumor weight of different groups of mice were measured. % cell growth, % colony formation, cell migration ratio and cell invasion ratio were calculated relative to the corresponding control cells. *p < 0.05.

