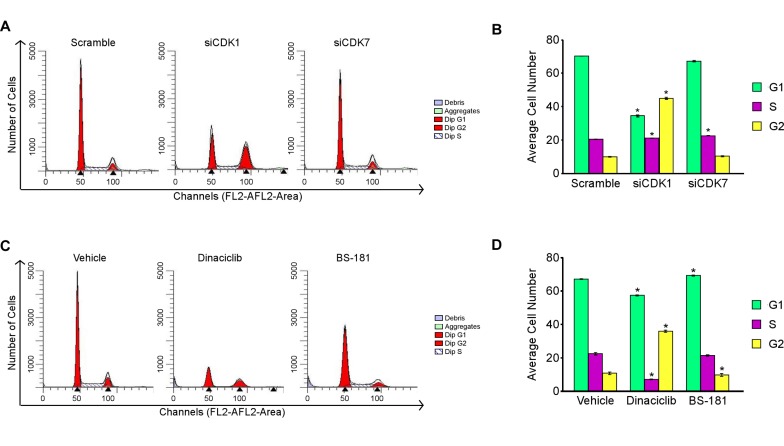
Figure 7. Effects of CDK1 and CDK7 inhibition on cell cycle progression.
Flow cytometry analysis of MDA-MB-231 cells following 48 hours of siRNA mediated knockdown of CDK1 and CDK7 A. and B. or drug mediated inhibition of CDK1 (10 nM dinaciclib) and CDK7 (20 µM BS-181) C. and D. relative to scrambled siRNA control or vehicle treated cells respectively. Transfections were performed with a pool of the two CDK1 or CDK7 siRNAs, or the control siRNA, at a final concentration of 25 nM. * Denotes significance at the P ≤ 0.05 level between the indicated treatments and controls.

