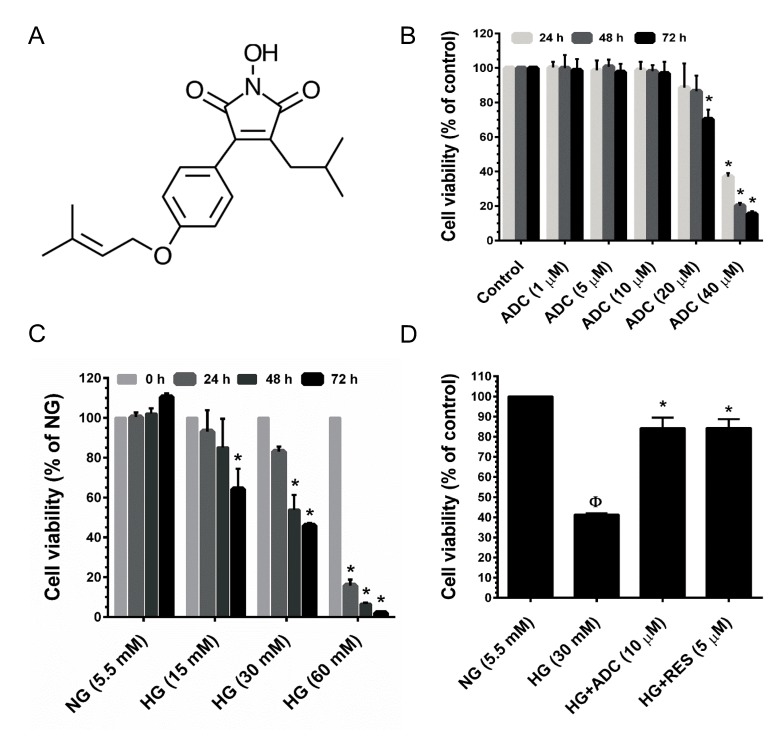
Figure 1. Cytotoxic effect of HG and ADC on HUVECs.
A. Chemical structure of Antrodin C (ADC). B. HUVECs were incubated with increasing concentrations of ADC for 24-72 h and the cell viability was measured by MTT assay. The percentage of cell viability was compared with the control (0.01% DMSO) group. C. HUVECs were incubated with various doses of HG for 24-72 h and cell viability was measured by MTT assay. The percentage of cell viability was compared with the NG treatment group. D. Cells were incubated with HG in the presence or absence of ADC or RES for 72 h. The percentage of cell viability was compared with the NG treatment group. Values represent the mean ± SD of three independent experiments. Statistical significance was set at ФP < 0.05 compared to NG vs. HG and *P < 0.05 compared to HG vs. samples.

