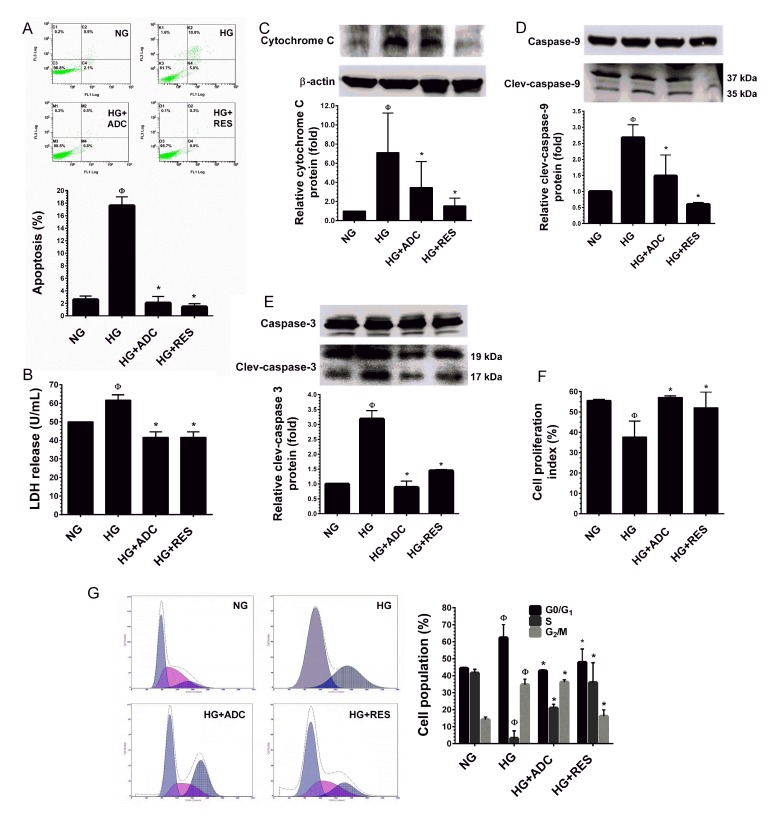
Figure 2. Protective effect of ADC on HG-induced HUVEC apoptosis and growth arrest.
A. HUVECs were incubated with HG in the presence or absence of ADC or RES for 72 h. Apoptotic cell death was performed with Annexin V/PI staining and the hypodiploid DNA was determined by flow cytometry. B. HUVECs were treated with HG in the presence or absence of ADC or RES for 72 h. LDH release in the supernatant of HUVEC cultures was measured by LDH assay kit as described in Materials and Methods. C.-E. Protein expression levels of cytochrome C, caspase-9 and caspase-3 levels were determined by western blot analysis. The relative protein expression of cytochrome C was normalized with β-actin, whereas cleaved capase-9 and cleaved caspase-3 levels were normalized with pro-caspase-9 and pro-caspase-3, respectively. F. HUVECs proliferation index was determined by flow cytometry. G. HUVECs were incubated with HG in the presence of ADC or RES for 72 h. Cell-cycle distribution was measured by flow cytometer using PI. Percentage of cell population in each transition phase is shown in the histogram. Values represent the mean ± SD of three independent experiments. Statistical significance was set at ФP < 0.05 compared to NG vs. HG and *P < 0.05 compared to HG vs. samples.

