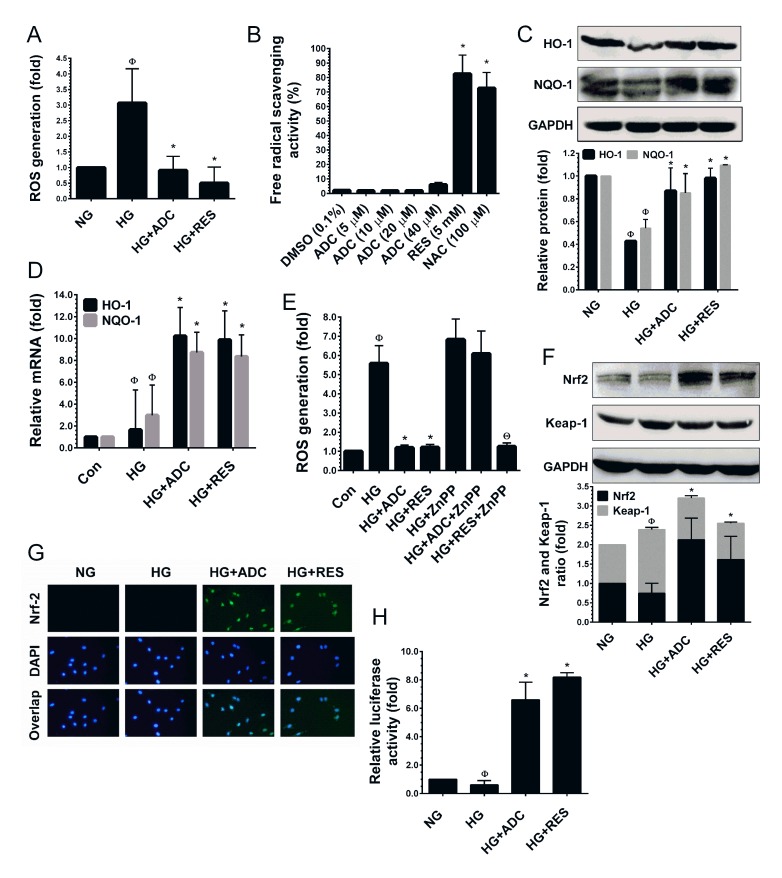
Figure 4. ADC activates Nrf2-dependent anti-oxidant defense in HUVECs.
A. To determine the ROS inhibitory effect of ADC, HUVECs were incubated with HG in the presence or absence of ADC or RES for 24 h. After incubation, intracellular ROS was measured by spectrometer using DCFH2-DA flurogenic probe. B. The free-radical scavenging activity of ADC was determined by DPPH assay. NAC and RES were used as positive controls. C.,F. Cells were treated with HG in the presence or absence of ADC or RES for 24 h. The protein levels of HO-1, NQO-1, Nrf2 and Keap-1 were determined by western blot analysis. D. To quantify the mRNA expression levels of HO-1 and NQO-1, HUVECs were incubated with HG in the presence or absence of ADC or RES for 24 h. Total RNA was subjected to Q-PCR analysis. Relative mRNA levels were normalized with β-actin mRNA. E. HUVECs were pre-treated with ZnPP (10 mM) for 2 h and then incubated with HG in the presence or absence of ADC or RES for 24 h. Intracellular ROS was quantified by spectrophotometer. G. The protein expression and nuclear localization of Nrf2 was determined by immunofluorescence analysis. The subcellular and nuclear localization of Nrf2 was photographed using a fluorescence microscope. DAPI was used to stain the nucleus. H. To determine the Nrf2 transcriptional activity, HUVECs were transiently transfected with ARE promoter construct using ipofectamine and incubated with HG in the presence or absence of ADC or RES for 6 h. Cell lysates were mixed with luciferase reagents and quantified using an illuminometer. The fold change of relative ARE promoter activity was compared with untreated cells (NG). Values represent the mean ± SD of three independent experiments. Statistical significance was set at ФP < 0.05 compared to NG vs. HG, *P < 0.05 compared to HG vs. samples and ΘP < 0.05 compared to HG vs. ZnPP pre-treatment group.

