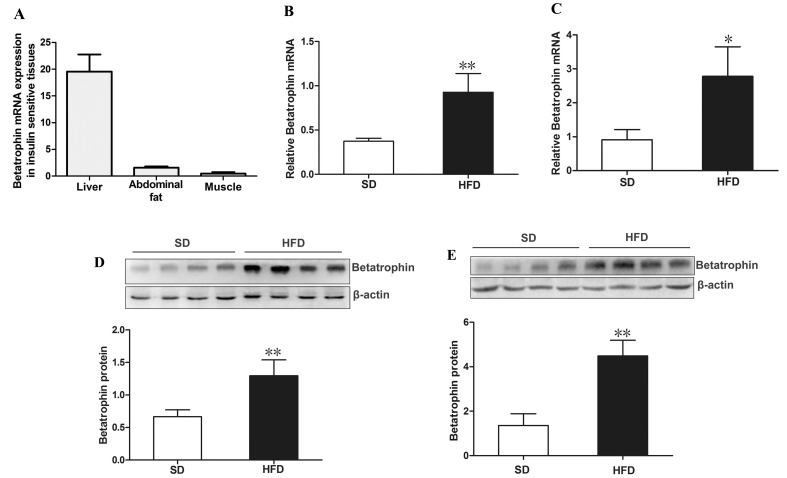
Figure 2. Expression of betatrophin at mRNA and protein levels in mice.
(A) Distribution of betatrophin mRNA expression in insulin target tissues from C57BL/6J mice (n=5). Betatrophin mRNA expression in liver (B) and fat (C) of SD- and HFD-fed mice. Betatrophin protein expression in liver (D) and fat (E) of SD- and HFD-fed mice (n = 5/group). SD, standard chow diet; HFD, high-fat diet; Data are presented as the mean ± SD. * P < 0.05, ** P < 0.01 vs. SD.

