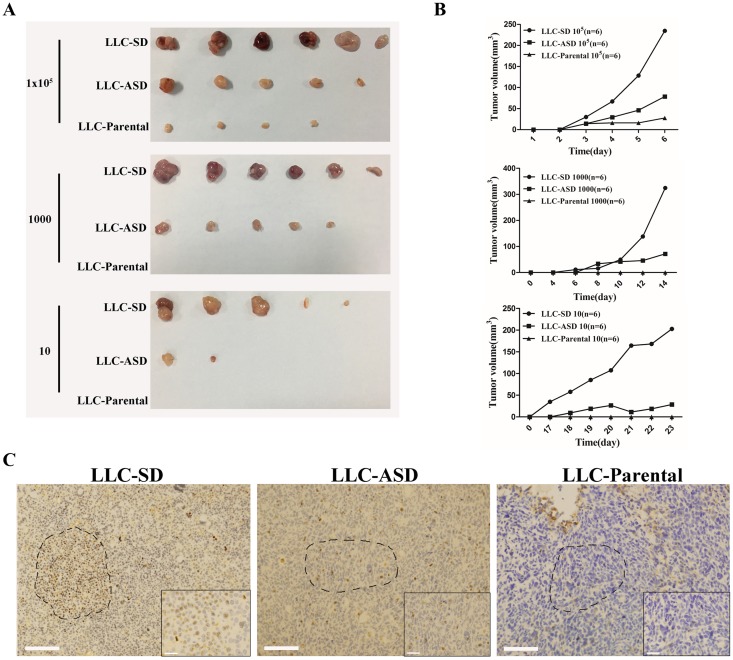
Figure 4. Tumorigenicity of LLC-SD and LLC-ASD in nude mice.
(A) the tumor formation in nude mice to which 105, 1000 and 10 LLC-SD, LLC-ASD and LLC-Parental cells were injected respectively. (B) the tumor volume tracking curve of 105, 1000 and 10 LLC-SD, LLC-ASD and LLC-Parental cells respectively. (C) immunohistochemistry analysis of BrdU-positive cells in growing tumors derived from 105 LLC-SD, LLC-ASD and LLC-Parental cells, bar=285um. the dotted line indicates the enlarged area, bar=30um.

