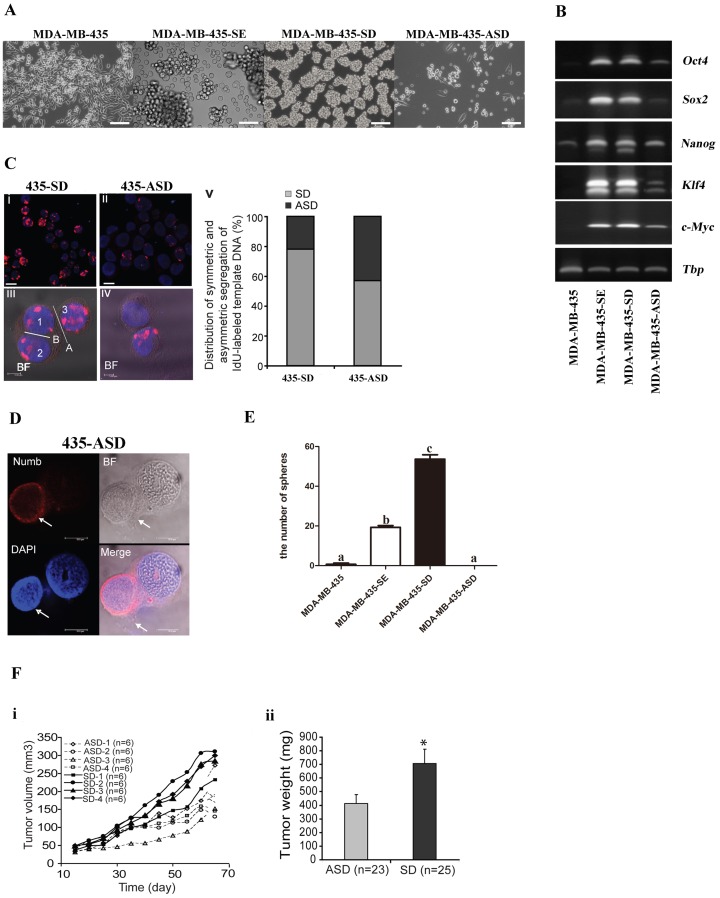
Figure 6. SD and ASD cell lines could be obtained from human cancer cells MDA-MB-435.
(A) the morphology of MDA-MB-435, MDA-MB-435-SE, MDA-MB-435-SD and MDA-MB-435-ASD, bar=120um. (B) the analysis of mRNA expression of embryonic stem cell markers (Oct4, Sox2, Nanog, Klf4 and c-Myc) in MDA-MB-435, MDA-MB-435-SE, MDA-MB-435-SD and MDA-MB-435-ASD, the tata-Box binding protein gene (Tbp) was reference gene. (C) Analysis of symmetric and asymmetric segregation of BrdU-labeled DNA during mitosis in MDA-MB-435-SD and MDA-MB-435-ASD. BrdU retention on day 6 after BrdU withdrawal in MDA-MB-435-SD (i) and MDA-MB-435-ASD (ii). (iii), #1 and #2: symmetric BrdU segregation between two daughter cells. #3: an adjacent BrdU-positive cell. (iv), asymmetric BrdU segregation between two daughter cells. (v) Quantification of SD and ASD cells in 100 dividing anaphase MDA-MB-435-SD and MDA-MB-435-ASD cells, respectively. Scale bars: 10 uM in (i-ii), 5 uM in (iii-iv). (D) asymmetric partitioning of Numb, in a pair of newly formed daughter cells in a dividing anaphase MDA-MB-435-ASD cell. (E) MDA-MB-435-SD exhibited significantly enhanced clonogeneicity and sphere-forming capability compared with corresponding MDA-MB-435, MDA-MB-435-SE and MDA-MB-435-ASD. a, b and c: different letters represent a significant difference, p < 0.05. (F) Tumor growth of four distinctive MDA-MB-435-SD and MDA-MB-435-ASD cell lines. (i), tumor volume; (ii), tumor weight. *: p=0.0025 determined by one-tailed t-test.

