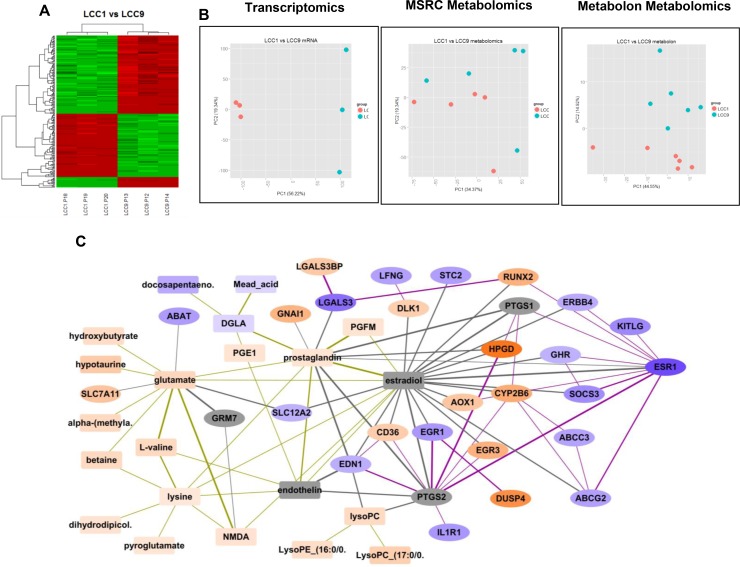
Figure 1. Analysis and integration of gene and metabolites in LCC1 (sensitive) and LCC9 (resistant) ER+ breast cancer cells.
(A) Heatmap: R package Limma was used for microarray analysis of LCC1 versus LCC9 data; significantly different genes were selected (q-value < 0.1, fold change, FC > 2) to plot the heatmap; there were 3-biological replicates. (B) Principal component analysis: PCA analysis performed for the transcriptomics and metabolomics datasets - MSRC and Metabolon. (C) Integration of differentially expressed genes and putative metabolites comparing LCC9 (resistant) and LCC1 (sensitive) cells. Metabolites are shown as rectangular nodes, and genes as ellipses. Orange nodes are over-expressed; blue nodes are under-expressed; darker color represents a higher fold change (FC). Lowest log2 FC = –5.66, highest log2 FC = 5.89. Grey nodes are those added into the network based on prediction by STITCH. Edge thickness increases with the confidence of the connection as predicted by STITCH. Gene-metabolite connections are shown in grey lines, gene-gene connections are shows as purple lines, and metabolite-metabolite connections are shown as gold lines. EGR1 is significantly decreased in LCC9 cells (log2 FC= –2.33).

