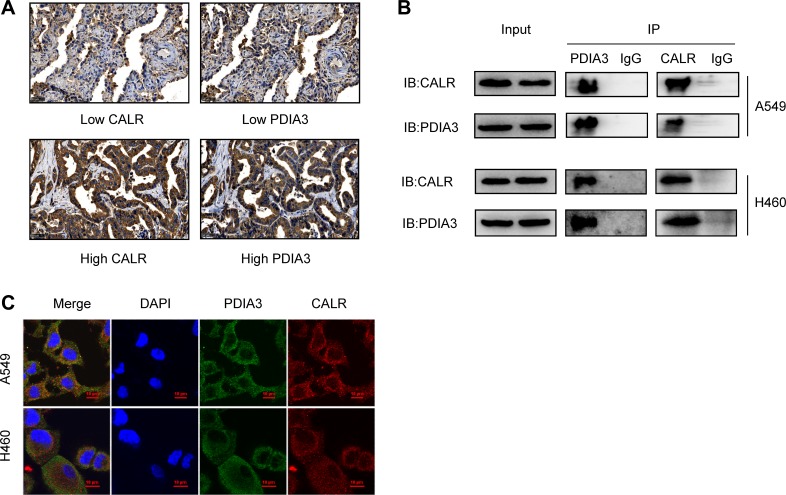
Figure 5. Correlation of CALR and PDIA3 in NSCLC.
(A) Co-expression of CALR and PDIA3 in patients with NSCLC detected by immunohistochemistry. Scale bar = 50 μm. (B) Interaction of CALR-PDIA3 in two lung cancer cell lines tested by co-IP assay. (C) Co-localization of CALR and PDIA3 in A549 and H460 cell lines visualized under a confocal florescence microscopy. Scale bar = 10 μm.

