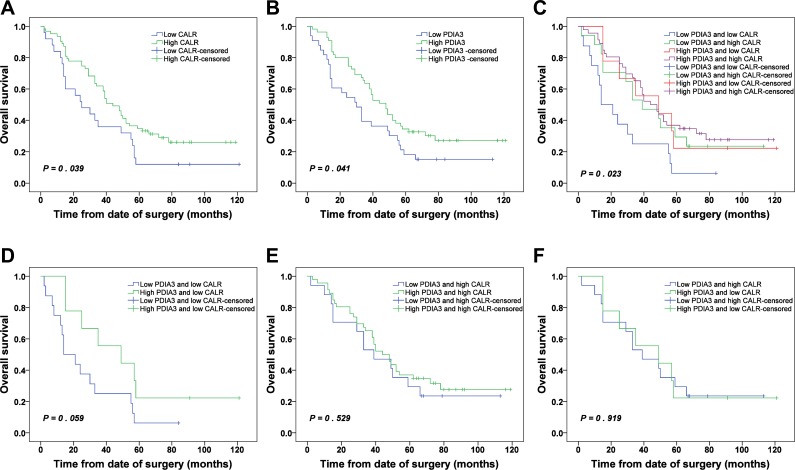
Figure 6. Kaplan-Meier survival analysis of CALR and PDIA3 expressions in NSCLC.
(A) OS of NSCLC patients with high and low CALR expressions. (B) OS of NSCLC patients with high and low PDIA3 expressions. (C) OS of NSCLC patients with combined expression of CALR and PDIA3. (D) OS of NSCLC patients with low PDIA3/low CALR and high PDIA3/low CALR. (E) OS of NSCLC patients with low PDIA3/high CALR and high PDIA3/high CALR. (F) OS of NSCLC patients with low PDIA3/high CALR and high PDIA3/low CALR.

