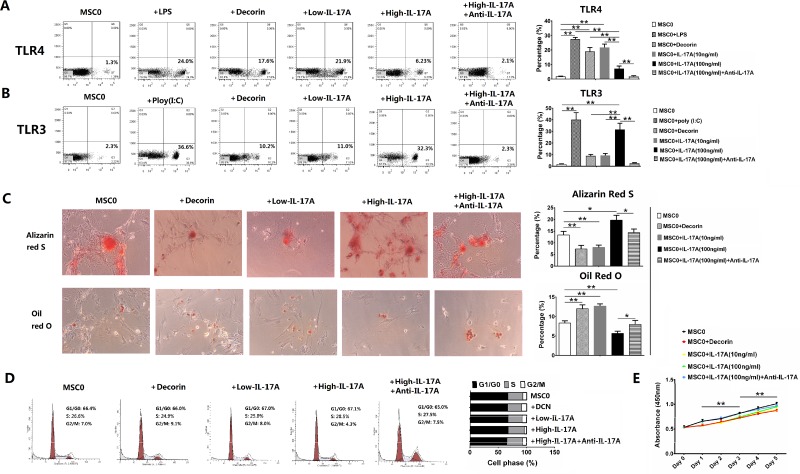
Figure 1. IL-17A mediated MSC1 and MSC2 polarizations in concentration-dependent way.
Values are the mean ± SEM (all n = 3). *P < 0.05, **P < 0.01. (A–B) Flow cytometry of murine MSCs. (C) Osteogenic and adipocytic differentiation of murine MSCs. (D) Distribution percentages of murine MSCs in G0/G1, S and G2/M phases of the cell cycle. (E) Cellular proliferation assay of murine MSCs .

