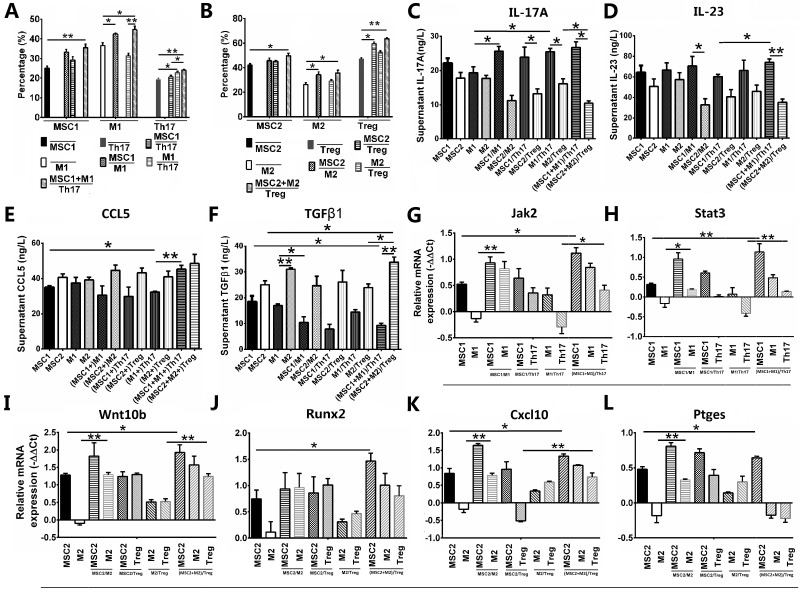
Figure 3. MSC1/2 polarizations promoted M1/2 and Th17/Treg polarizations in coculture analysis, respectively.
Values are the mean ± SEM (all n = 3). *P < 0.05, **P < 0.01. (A) Flow cytometry of MSC1, M1 and Th17 as monocultures or co-culture. (B) Flow cytometry of MSC2, M2 and Treg as monocultures or co-culture. (C–F) The analysis for supernant IL-17A (C), IL-23 (D), CCL5 (E) and TGF-β1 (F) in Elisa. (G–L) The relative mRNA expression of Jak2 (G), Stat3 (H), Wnt10b (I), Runx2 (J), Cxcl10 (K) and Ptges (L) in RT-qPCR.

