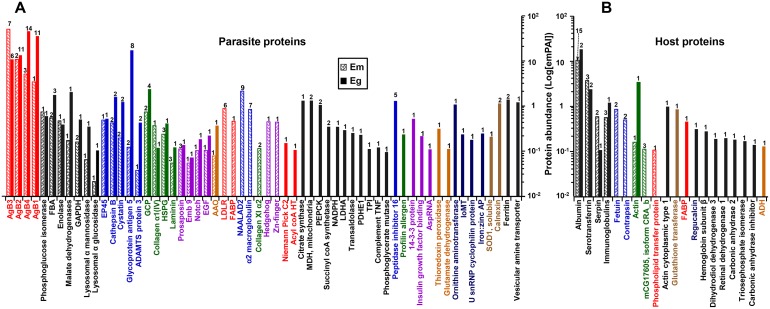
Figure 4. Differential heat map of the E. multilocularis hydatid fluid (EmHF) and E. granulosus HF (EgHF) proteins.
The 26 most abundant parasite proteins (A) and top five host proteins (B) that showed emPAI values above 0.01 were analyzed. Protein abundance is presented by log[emPAI]. Antigen B isoforms, whose main functions are related to lipid transportation and assimilation, and Th2 responses are marked by red. Enzymes involved in carbohydrate metabolism are indicated by black. Molecules associated with proteolysis and inhibitors are shown in blue. Extracellular matrix and cytogenetic proteins are denoted by green. Molecules associated with cell growth and development are shown in purple. AgBs, Em and Eg antigen Bs; Ag5, glycoprotein antigen 5; AspRNA, aspartyl tRNA synthetase (cytoplasmic); GAPDH, glyceraldehyde 3-phosphate dehydrogenase; FBA, fructose bisphosphate aldolase; EP45, estrogen regulated protein 45; HSPG, basement membrane specific heparan sulfate; Emb9, abnormal EMBroylocus tagsis(embryogenesis family member) emb 9; Notch, neurogenic locus notch protein; EGF, EGF domain protein.

