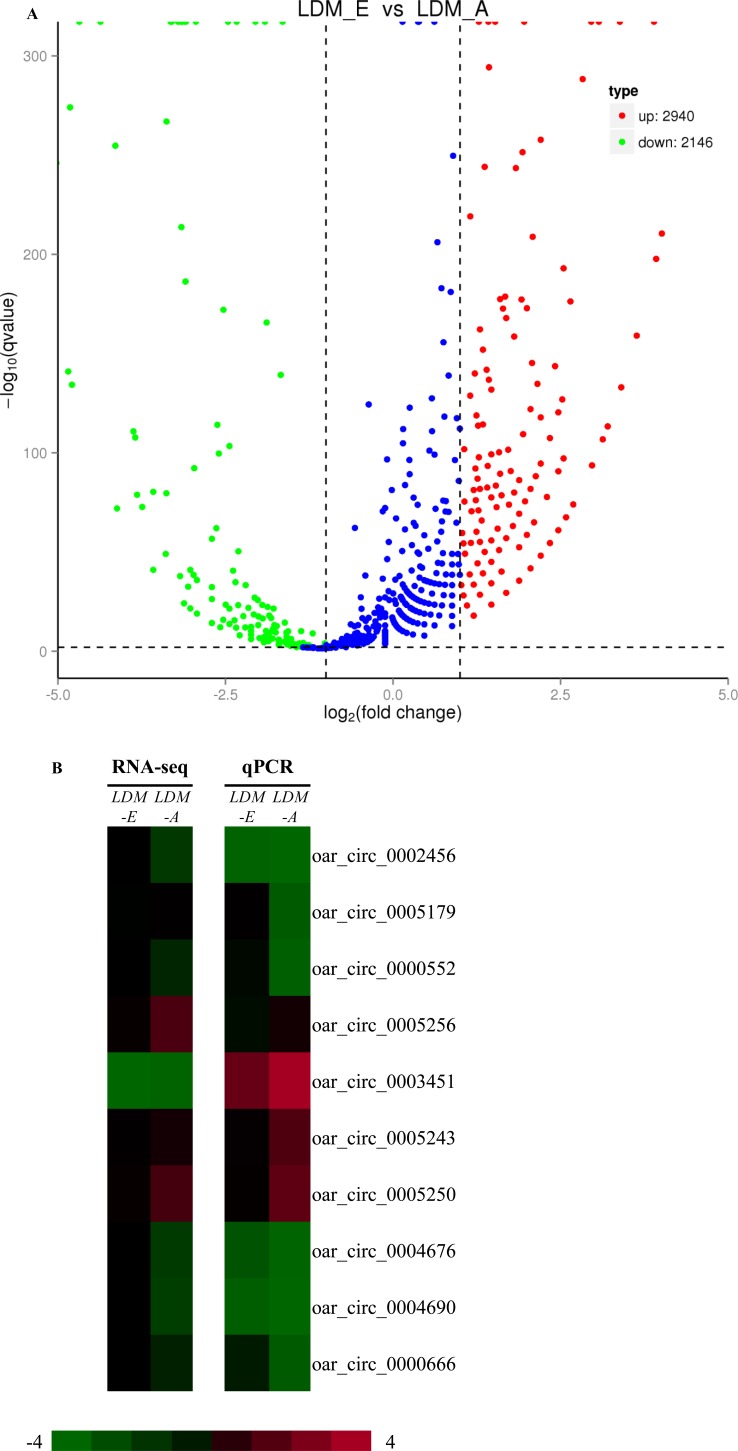
Figure 4. Analysis and validation of differentially expressed circRNAsin LDM_E and LDM_A group.
(A) The volcano plot analysis of all circRNAs between LDM_E and LDM_A group. The logarithm of the significant difference between the two samples was analyzed by log2 (fold change) as the abscissa, and the negative logarithm-log10 (P-value) of the P value was calculated as the ordinate (P < 0.05).Red dots indicate up-regulated genes; green dots indicate down-regulated genes. (B) Heapmap analysis of ten differentially expressed genes was performed with data from RNA-seq and Real-Time RT-PCR. Green represents low expression, and red represents high expression, P < 0.05.

