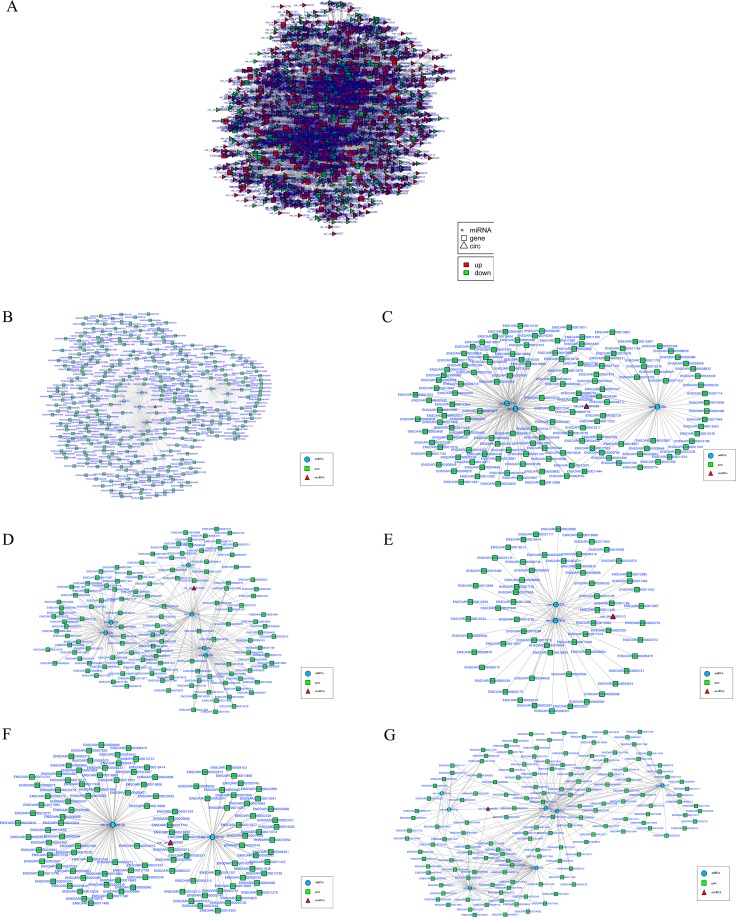
Figure 6. The circRNA-miRNA co-expression network.
(A) The circRNA-miRNA-mRNA interaction network between circRNA and its target gene. Ellipse nodes represent miRNAs, rectangle nodes represent genes and triangle nodes represent circRNAs. Red color and green color represents up and down regulation respectively. (B-G) The circRNA-miRNA-mRNA network with potentially effective circRNAs (circRNA 0000385 (B), circRNA 0000582 (C), circRNA 0001099 (D), circRNA 0001413 (E), circRNA 0003451 (F), circRNA 0005250 (G). Ellipse nodes represent miRNAs (blue), rectangle nodes represent genes (green) and triangle nodes represent circRNAs (red).

