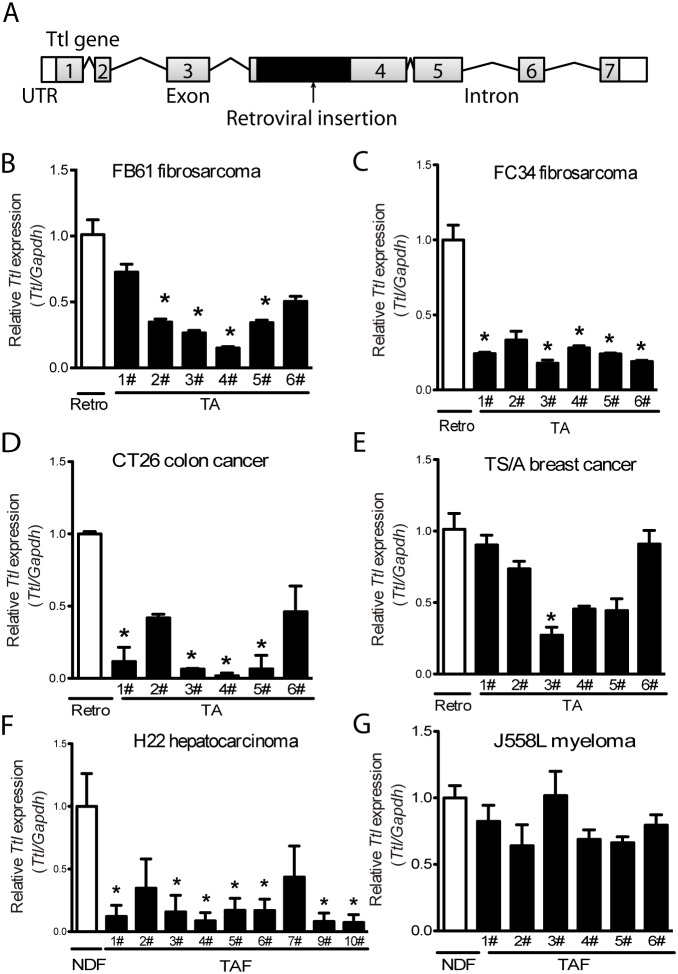
Figure 3. Suppressed stromal Ttl expression in different mouse tumor models.
(A) Schema of the retroviral integration site in the Ttl gene. Grey boxes with numbers represent the exons. Lines represent introns. Black boxes indicate the inserted retroviral genome. White boxes indicate untranslated regions (UTR). (B-E) Ttl mRNA levels in retro-MEFs and TA-MEFs (TA) isolated from (B) FB61, (C) FC34, (D) CT26, or (E) TS/A tumors. (F-G) Ttl mRNA levels in normal dermal fibroblasts (NDFs) and tumor-associated fibroblasts (TAFs) isolated from the subcutaneously transplanted (F) H22, n=10, and (G) J558L tumors, n=6. (B-G) Each bar indicates RT-PCR replicates of one batch of stromal cells re-isolated from a distinct tumor. Mean ± SEM, *P< 0.05, Student’s t test, n=6 per model; data are representative of two independent experiments.

