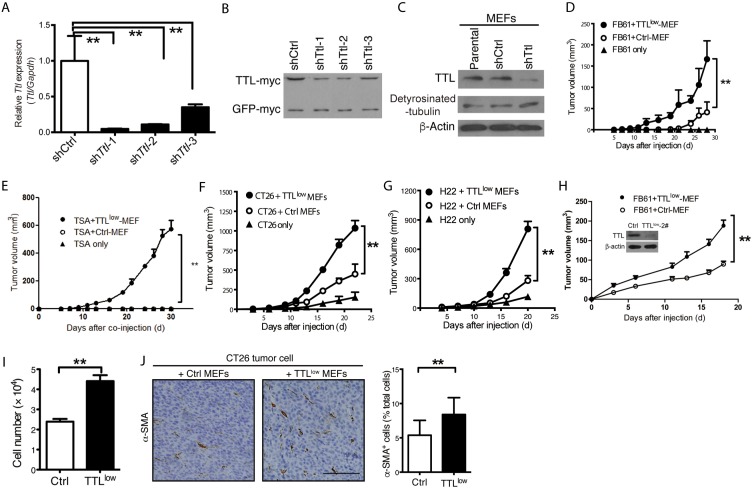
Figure 4. Promoted tumor growth by suppressed stromal Ttl expression.
(A-C) Knock-down of Ttl in MEFs by three shTtl sequences. Three shTtl sequences were cloned into pSUPER.retro.puro plasmid. The 293T cells were transfected with either shTtl or non-targeting shCtrl vectors, together with a plasmid that carries murine Ttl and GFP cDNA with independent myc-tags for the expression of murine Ttl in the 293T cells, which is human origin. The efficacy of shTtl was determined after 24 hours. (A) Real time RT-PCR. Mean ± SEM, **P< 0.01, Student’s t test, n=3 RT-PCR replicates; data are representative of two independent experiments. (B) Western-blot analysis using an antibody specific for the myc-tag to show TTL-myc (∼45 kDa) in comparison to GFP-myc (∼27 kDa) as control for transfection efficiency. Data are representative of two independent experiments. (C) MEFs were transduced with shTtl-1 (shTtl) or shCtrl retroviral particles. Western-blot analysis using antibodies specific to TTL (∼45 kDa) and detyrosinated α-tubulin (detyrosinated-tubulin; ∼50 kDa). β-actin (∼ 42 kDa) served as loading control. Data are representative of three independent experiments. (D-G) TTLlow MEFs (transduced with shTtl-1) or Ctrl MEFs were co-injected with 2×10⁴ (D) FB61, (E) TS/A, (F) CT26, or (G) H22 tumor cells. As a control, 2×10⁴ tumor cells were injected alone. Tumor volumes were monitored over time as indicated. Mean ± SEM, **P< 0.01, two-way ANOVA, n = 6 per group; data are representative of two of three independent experiments. (H) 1×10⁶ TTLlow MEFs (transduced with shTtl-2) or control MEFs were co-injected with 2×10⁵ FB61 tumor cells. Tumor volumes were monitored over time. Mean ± SEM, *P < 0.05, two-way ANOVA, n=3; data are representative of two independent experiments. Insert: Western-blot analysis for Ttl and β-actin in MEFs transduced with shTtl-2 as described for Figure 4C. (I) Aormazan-based assay were used for cell proliferation analysis of TTLlow MEFs or control MEFs. Mean ± SEM, **P < 0.01, Student’s t-test, n = 6 culture replicates; data are representative of three independent experiments. (J) CT26 tumor cells were co-injected into mice with either TTLlow or control MEFs. Tumor sections were stained with α-SMA (brown). (Left) Representative images for the staining are shown. Scale bar, 50 μm. (Right) The proportion of α-SMA+ cells in the total cells was calculated (counted with nuclear numbers) from 5-6 visual fields (35 visual fields in total) of 3 sections of each tumor. Mean ± SEM, **P < 0.01, Student’s t-test, n=6 tumors per group; data are representative of three independent experiments.

