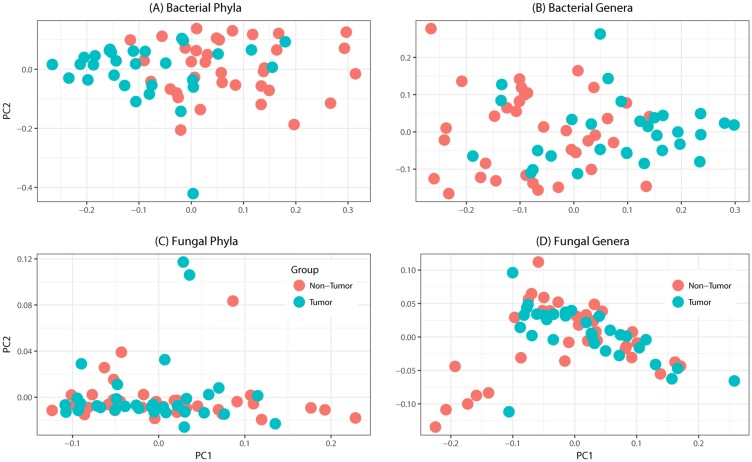
Figure 1.
Principal coordinates analysis of oral tongue tumor samples and matched non-tumor oral epithelium samples at the phylum (left) and genus (right) levels for (A-B) bacteriome or (C-D) mycobiome. Overall oral microbiomic diversity of patient tumor (green) and matched non-tumor (orange) samples as represented by the first two principal coordinates on principal coordinates analysis of unweighted UniFrac distances. Each point represents a single sample.

