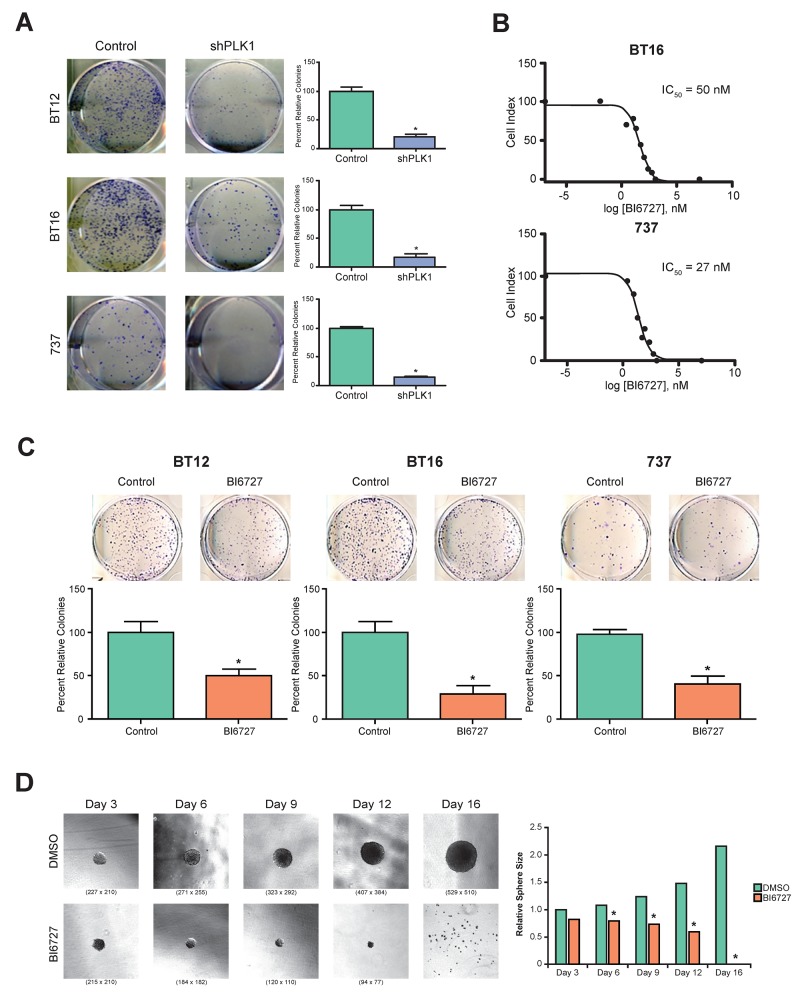
Figure 2. Genetic and pharmacological inhibition of PLK1 in ATRT cell lines: tumor cell growth and tumor-sphere formation was inhibited.
(A) Three ATRT cell lines, BT12, BT16 and MAF-A737, were used to study the effect of PLK1 inhibition using shRNA. Knockdown of PLK1 significantly decreased the tumor cell colony forming efficiency in all three ATRT cell lines (p< 0.05 shPLK1 vs. control (shNULL)). (B) BI6727 (Volasertib), a specific inhibitor of PLK1 was used to inhibit PLK1 expression in ATRT cell lines. Various concentrations of BI6727 were used to identify IC50 of the drug in all three ATRT cell lines and cell proliferation was measured by XCELLigence system. The representative IC50 graph for BT16 and 737 cell lines were shown. (C) The three ATRT cell lines, BT12, BT16 and MAF-A737, treated with the IC30 concentration of BI6727, 30 nM, and 14.5 nM respectively, showed marked decrease in cell colony forming ability. Representative images and the quantification of colonies formed were shown. *p < 0.05 control (DMSO) vs. BI6727 treatment, ±SEM. (D) BI6727 suppresses the tumor sphere formation of ATRT cell line, MAF-A737. The average diameter of the neurospheres decreased with IC50 of BI6727 treatment after 3, 6, 9,12 and 16 days of culture. Bright field images of neurospheres after indicated days of culture in the neurosphere media with bFGF and EGF are shown. Quantitation of average neurosphere diameter was shown in bar graph (*p <0.05 BI6727 vs Control, DMSO).

