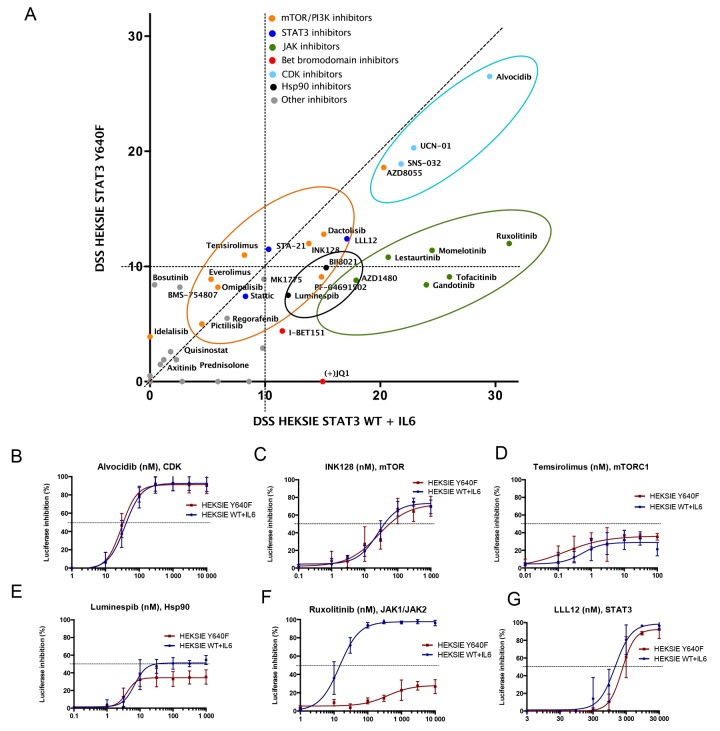
Figure 1. mTOR, CDK, Hsp90 and JAK inhibitors reduce STAT3-induced reporter activity.
(A) Correlation of drug sensitivity scores (DSS) indicating luciferase activity inhibition in HEK293-SIE cells after 6 h compound treatment. DSS is a quantitative measurement of a drug response based on the area under the curve (AUC) with further normalization. Y-axis: HEK293-SIE cells stably expressing constitutively active Y640F STAT3. X-axis: HEK293-SIE stably expressing WT STAT3 + IL6 stimulation (100 ng/ml) 15 min before addition of the compounds. The experiment was repeated two times and mean DSS values are shown in the plot. (B-G) Dose response curves showing inhibition of luciferase activity after treatment with alvocidib (CDK inhibitor), INK128 (mTORC1/mTORC2 inhibitor), temsirolimus (mTORC1 inhibitor), luminespib (Hsp90 inhibitor), ruxolitinib (JAK1/2 inhibitor) and LLL12 (STAT3 inhibitor). Error bars represent ±SD, n=3.

