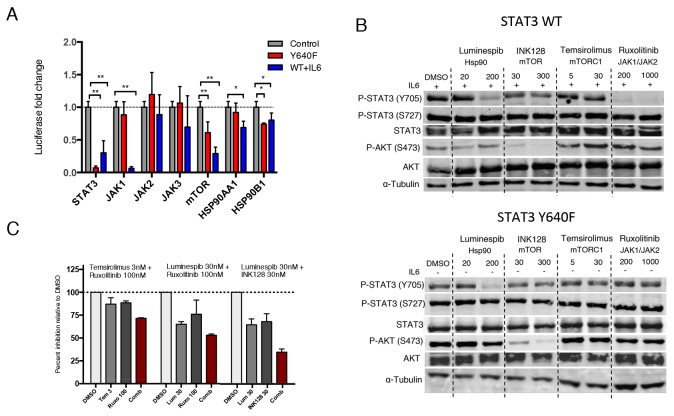
Figure 2. Hsp90 inhibition abrogates both mutant and WT STAT3 activity and phosphorylation.
(A) Silencing of target proteins using three different siRNAs for each gene. Luciferase activity was measured after 3 days and are relative to mock siRNA treated cells. Both cell lines were independently normalized to their corresponding mock treated cells. The mean values ± S.D. of 2 independent experiments are presented in the graph, *P<0.05, **P<0.01 (Mann-Whitney U-test). (B) WT or mutant STAT3 expressing HEK293-SIE cells were treated with the indicated compounds or DMSO for 8 h, followed by western blotting for Y705 P-STAT3, S727 P-STAT3, STAT3, S473 P-AKT, AKT and α-Tubulin. WT STAT3 expressing cells were stimulated with 100ng/ml IL-6 before treatment. (C) Effect of three different drug combinations on mutant STAT3-dependent reporter signal. Compounds were incubated for 6 h followed by luciferase signal measurement and are relative to DMSO control. Histograms show the inhibitory effect of a drug combination and individual drugs of two independent experiments. Synergism scores and 2D contour plots from concentration matrix are presented in Supplementary Figure 2.

