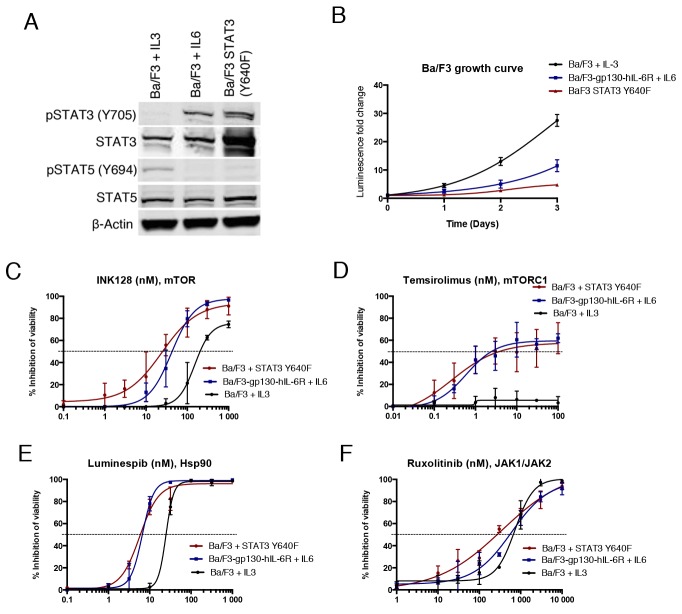
Figure 3. STAT3 dependent Ba/F3 cells show increased sensitivity to Hsp90 and mTOR inhibition.
(A) Western blot analysis showing Y705 P-STAT3 and total STAT3 protein levels of different Ba/F3 cell lines: Ba/F3 Y640F STAT3, Ba/F3 cells expressing gp130-hIL-6R cultured with IL6 (10 ng/ml), and parental Ba/F3 cells cultured with IL3 (10 ng/ml). (B) Growth curves of Ba/F3 cell lines. Cells were cultured for 3 days and viability was measured each day with the CTG assay. (C-F) Cell viability inhibition of Ba/F3 cells after treatment with INK128, temsirolimus, luminespib and ruxolitinib for 3 days. Cell viability was measured with CTG and error bars represent ±SD (n=3).

