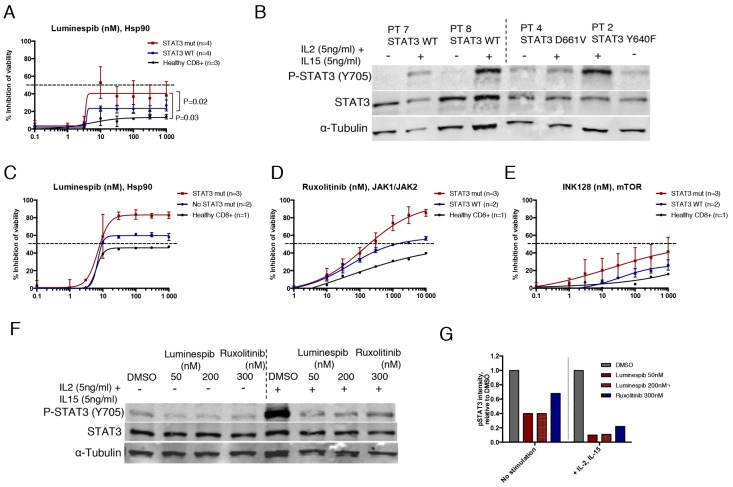
Figure 5. Hsp90 inhibition abrogates STAT3 phosphorylation and viability of mutant STAT3 harboring LGL leukemia patient samples.
(A) Dose response curves representing cell viability inhibition of eight T-cell LGL leukemia patient samples and three healthy controls treated with luminespib for 3 days. Cells were purified with CD8+ magnetic beads. Error bars represent the mean ±SD of patient groups with or without STAT3 mutations (n=4) or healthy controls (n=3). (P-values, Mann-Whitney U-test). (B) Western blot analysis showing Y705 P-STAT3 and total STAT3 protein levels of four LGL leukemia samples of which two harbored STAT3 mutations and two WT STAT3. Freshly purified CD8+ T-cells were incubated either in MCM media or MCM media supplemented with IL2 (5 ng/ml) and IL15 (5 ng/ml) for 1 h after protein lysates were prepared. (C-E) Cell viability inhibition of purified CD8+ LGL-leukemia patient cells treated 72 h with luminespib, ruxolitinib and INK128. Cells were cultured in the presence of IL2 (5 ng/ml) and IL15 (5 ng/ml). (F) Western blot analysis showing Y705 P-STAT3 and total STAT3 protein levels of patient 3 (Y640F, 42%) after treatment with luminespib or ruxolitinib with indicated concentrations for 16 h. Half of the cells were cultured in MCM and the other half in MCM + IL2 (5 ng/ml) and IL15 (5 ng/ml). (G) P-STAT3 band intensities of western blot images were quantified using Odyssey imaging system application software. P-STAT3 intensities were normalized to α-Tubulin and are relative to the DMSO control. Cells cultured with or without interleukins were normalized to their own DMSO controls.

