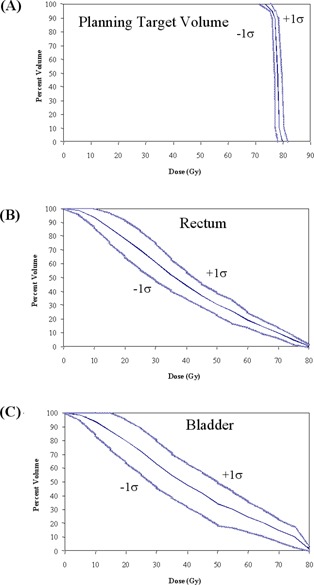
Figure 3.

Dose–volume histograms (solid blue lines) and the standard deviation (light blue lines) for (A) mean planning target volume (PTV), (B) rectum, and (C) bladder for 30 prostate tomotherapy patients. The PTV consists of the prostate with a 5‐mm posterior margin and a 10‐mm margin in all other directions.
