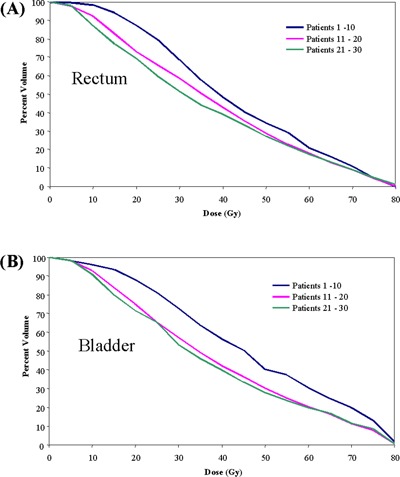
Figure 4.

Dose–volume histograms of mean (A) rectum and (B) bladder for 30 prostate tomotherapy patients sorted chronologically into groups of ten. The level of rectal and bladder conformal avoidance increased with inverse treatment planning experience.
