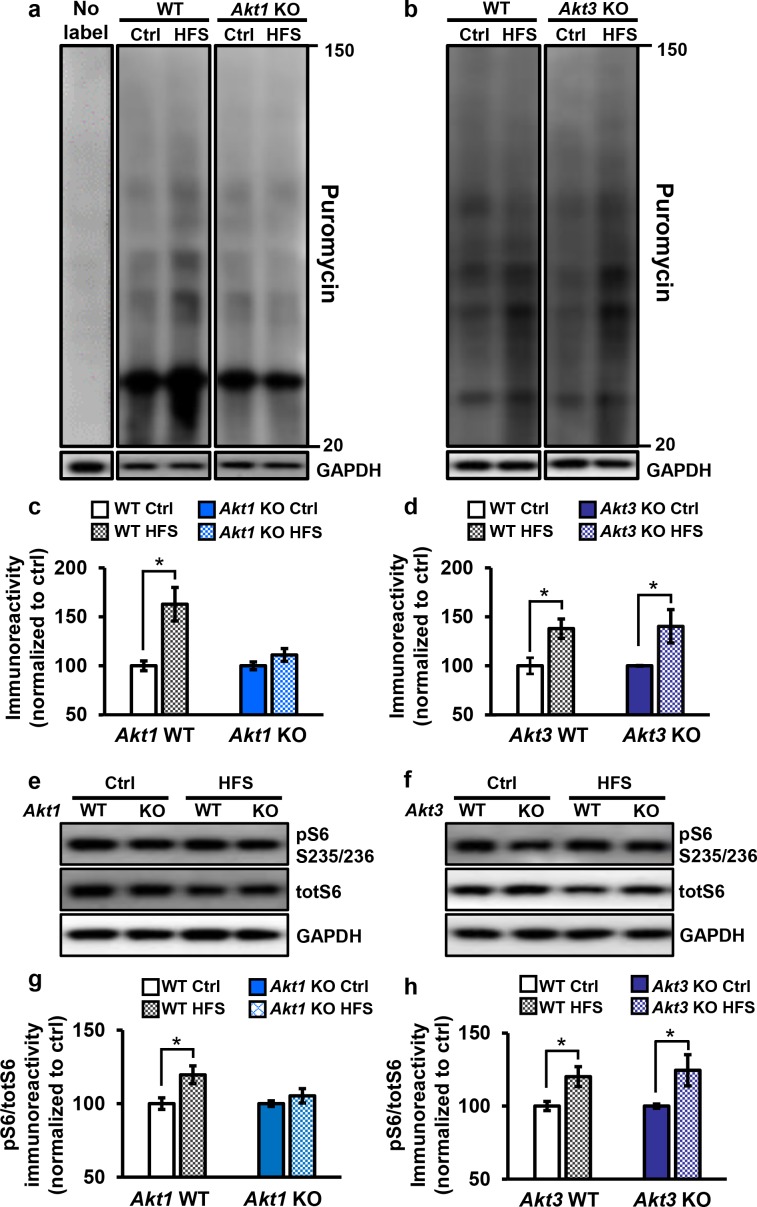
Figure 5. Only Akt1 KO mice show an impaired protein synthesis response after tetanic stimulation.
(a,c) Puromycin labeling of newly synthesized proteins showed that four trains of HFS in area CA1 to induce L-LTP results in increased protein synthesis levels compared with no stimulation (Ctrl) in WT hippocampal slices (t(14)= −3.52, p=0.005), while stimulated Akt1 KO slices fail to increase protein synthesis from unstimulated levels (t(14)=-1.45, p=0.167). GAPDH, loading control. (b,d) Akt3 KO hippocampal slices showed a normal increase in protein synthesis after four trains of HFS (Akt3 WT Ctrl vs. HFS t(12)=-2.75, p=0.018; Akt3 KO Ctrl vs. HFS t = −2.20, p=0.047). GAPDH, loading control. (e,g) Akt1 KO slices failed to show an increase in S6 phosphorylation (pS6 S235/236) normalized to total S6 (totS6) levels after tetanic stimulation (Akt1 WT Ctrl vs. HFS t(14)=-2.71, p=0.016; Akt1 KO Ctrl vs. HFS t(14)=-1.01, p=0.33). (f,h) Akt3 KO slices showed a normal increase in pS6 S235/236 levels after tetanic stimulation (Akt3 WT Ctrl vs. HFS t(14)=-2.92, p=0.01, Akt3 KO Ctrl vs. HFS t(14)=-2.59, p=0.02). n= 7–11 slices/group, 4–6 mice/group, *p<0.05.

