. 2017 Nov 22;6:e30552. doi: 10.7554/eLife.30552

Figure 7. mspTMS evoked multiphasic response alternating between excitation and inhibition.

(A) Raster plot (top) and PSTH (bottom; binsize 1 ms) of multiunit spike activity evoked by mspTMS (stimulus orientation ML; intensity 120% MT; onset at 0 ms) recorded in layer V of the CFA from one animal. (B) Traces of evoked MUAPs (corresponding to trials in A) obtained by intramuscular EMG in the biceps (bi.) brachii muscle contralateral and ipsilateral to the stimulated CFA. (C–F) Population average (N = 7) of normalized multiunit FR in the layer V of CFA evoked by ML-oriented mspTMS of increasing intensity. The PSTHs were smoothed by a Gaussian kernel for visualization. Inset, example traces of evoked MUAP in the contralateral bi. brachii from one animal. Dashed lines, significance thresholds determined by the 2.5 or 97.5 percentile of the empirical distribution of baseline normalized FR (see Materials and methods for details).

Figure 7.

Figure 7—figure supplement 1. Histological confirmation of electrode placement.

Figure 7—figure supplement 1.

The hematoxylin and eosin stained coronal section confirms the placement of recording electrode (Rec) in layer Vb of CFA and the placement of reference electrode (Ref) outside of the primary motor cortex. The location of Rec was marked by an electrolytic lesion after the experiment and the location of Ref, while not marked by lesioning, is also visible (* in the left inset). The scale bar for the insets represents 20 μm distance. CC indicates corpus callosum. Latin numbers I to VI represent the different cortical layers.
Figure 7—figure supplement 2. MUAP evoked by single-pulse ICMS.

Figure 7—figure supplement 2.

In one animal, we stimulated layer V of the left CFA with a single ICMS pulse and recorded intramuscular EMG in both left (ipsilateral to the stimulated motor cortex; not shown) and right (contralateral) biceps brachii. The evoked MUAPs, detected solely in the right biceps brachii, displayed onset latencies (11–12 ms) similar to those obtained in our TMS experiment, suggesting the cortical origin of the TMS-evoked MUAPs.
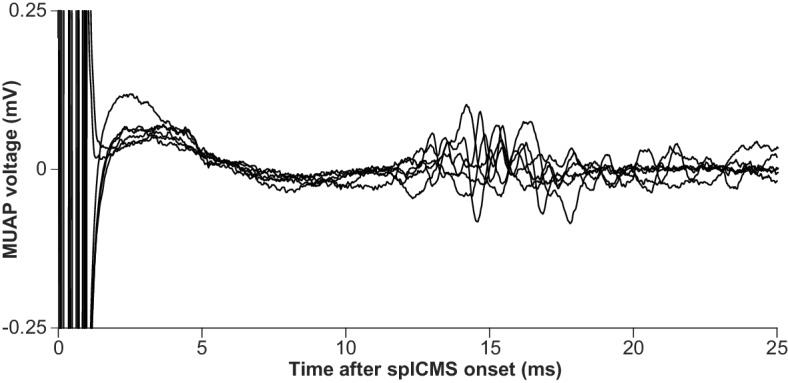
Figure 7—figure supplement 3. Layer V neuronal response evoked by PA-oriented mspTMS at different intensities.

Figure 7—figure supplement 3.

Population average (N = 4) of normalized multiunit FR in layer V of CFA evoked by PA-oriented mspTMS. The histograms were constructed using the same procedures as those described for Figure 7C–F. Insets, zoom-ins (0–40 ms) on the PSTH of evoked normalized FR with no smoothing. Dashed lines, significance thresholds determined by the 2.5 or 97.5 percentile of the empirical distribution of baseline normalized FR (see Materials and methods for details). TMS was delivered at time 0 ms.
Figure 7—figure supplement 4. mspTMS evoked a multiphasic pattern of neuronal response in layer II/III.

Figure 7—figure supplement 4.

In five animals (299 trials total), we recorded multiunit activities in layer II/III (400 µm from the cortical surface) of the CFA under mspTMS (ML orientation) at 120% MT. The histograms were constructed using the same procedures as those described for Figure 7C–F. The TMS-evoked multiphasic pattern of FR found here is qualitatively similar to that obtained in layer V (Figure 7C–F). Insets, zoom-ins (0–40 ms) on the PSTH of evoked normalized FR with no smoothing. Dashed lines, significance thresholds determined by the 2.5 or 97.5 percentile of the empirical distribution of baseline normalized FR (see Materials and methods for details). TMS was delivered at time 0 ms.