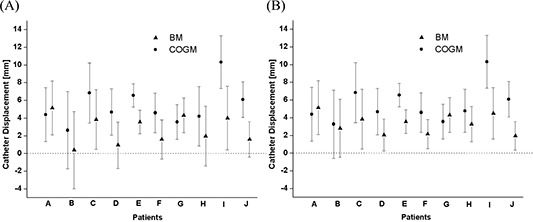
Figure 2.

(A) Measurement of craniocaudal catheter displacement using the bony markers (BM) method and the center of two gold markers (COGM) method for 10 patients. In each patient's graph, the filled triangle and filled circle represent the mean values of the BM and COGM measurement displacements from day 1 to day 2 respectively, and the error bars show one standard deviation. (B) All data were changed into absolute values and re‐plotted.
