
Figure 8.
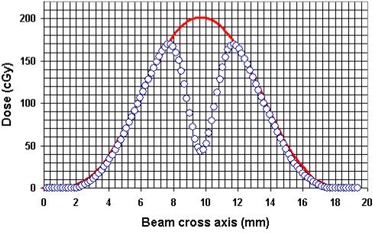
The beam profile film images, taken without (solid line) and with (open circles) the steel sphere installed at the mechanical isocenter, as shown in Figs. 4 and 6 respectively. The beam central axis position corresponds to the maximum of the solid line curve and the steel sphere center position corresponds to the minimum of the circle curve. The optical density data have been converted to dose in this graph, but the conversion was not really required for position analysis.