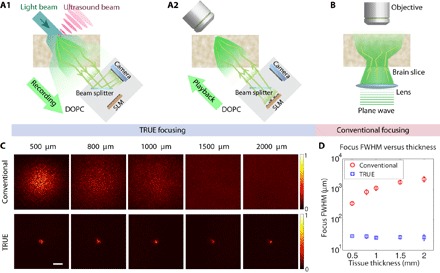
Fig. 2. A comparison of TRUE focusing and conventional focusing.

(A) The recording (A1) and playback (A2) procedures used to focus light through the slice onto its top surface with TRUE focusing. (B) Diagram of the experimental setup for measuring the light intensity distribution of the focus on the top surface of the brain slice achieved using a conventional lens illuminating the brain slice from below. A tube lens and a camera used together with the objective are not shown. (C) Images of the conventional and TRUE focus profile through living brain tissue slices (500, 800, 1000, 1500, and 2000 μm thick). (D) Full width at half maximum (FWHM) focal spot sizes for the conventional and TRUE foci as a function of tissue thickness. Error bars represent the SD of five measurements taken at different locations. Scale bar, 100 μm.
