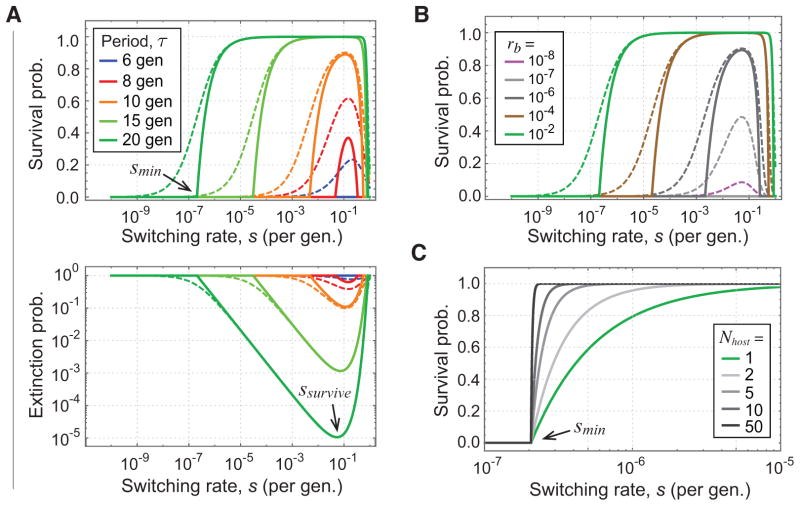
FIG. 1.
Dependence of survival probability on stochastic switching and infection rates. (A) Upper panel shows the survival probability of the local pathogen population as a function of switching rate s for different growth period durations τ in units of generations (gen.), i.e. f = 1; lower panel shows the extinction probability on a logarithmic scale. Dashed curves are the survival (Psurvive) or extinction (Pextinct) probability of a local population after a single growth period; solid curves indicate long-term survival (P̂survive) or extinction (P̂extinct) probability of a pathogen lineage. The minimum value of the switching rate that allows long-term survival, smin, and the switching rate that maximizes survival, ssurvive, are indicated. Plots show results for infection probability ra = 0 and rb = 0.01 using Eq. 1 to calculate Pextinct and Eq. 30 to obtain P̂extinct. (B) Dependence of survival probability of a local population on transmission probability rb, for ra = 0 and τ = 20 gen. (C) Survival probability of the global pathogen population approaches a step function with increasing Nhost, the number of initially infected hosts. The extinction-survival threshold smin is shown. Curves plot 1−(P̂extinct)Nhost for the values of Nhost indicated using ra = 0, rb = 0.01, and τ = 20 gen.

