
Figure 1. Tgfbr2myeko mice develop severe neurodeficits and spontaneous stroke.
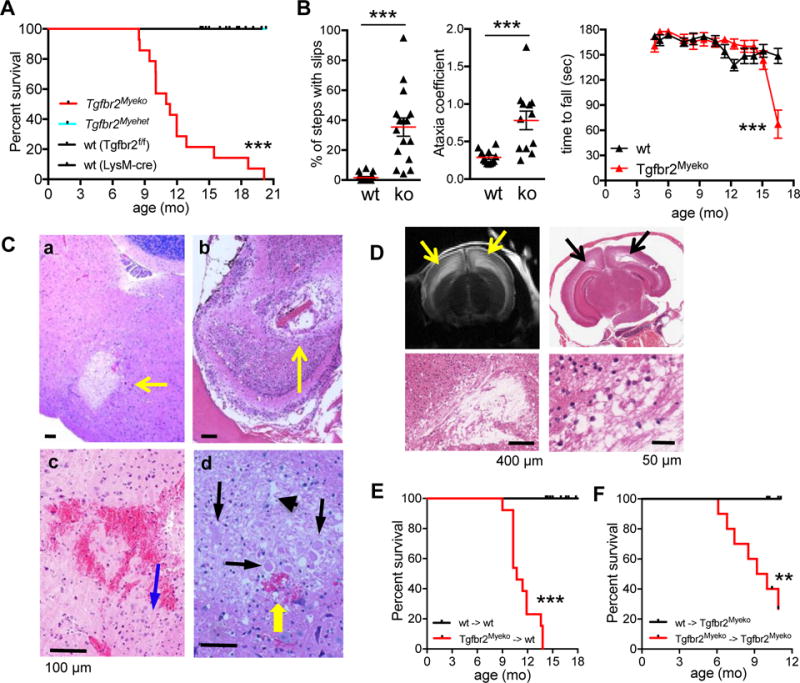
(A) Decreased overall survival of Tgfbr2Myeko (n=19) and compared with wt (Tgfbr2fl/fl, n=25 and LysM-cre, n=3) and heterozygous (Tgfbr2Myehet, n=9) littermates. Mice were sacrificed for humane endpoints, which included head tilt, abnormal gait, severe trembling, paresis or paralysis, or weight loss of >20% due to severe neurological impairments. p, Tgfbr2Myeko vs wt. (B) Decreased motor function and gait disturbance in Tgfbr2Myeko (ko) mice. Foot slips on ladder traversal test (n=4, left panel) and ataxia coefficient from Digigait analysis (n=3, center panel) in 9 mo-old pre-stroke Tgfbr2Myeko mice and wt littermates. Each data point is from one foot from one mouse, 4 points per mouse. Serial rotarod testing of young mice until decline in performance (n=5, right panel). (C) Post-ischemic brain lesions in Tgfbr2Myeko mice. H&E staining of brain sections from Tgfbr2Myeko stroke mice with neurological impairment: a, focal sub-acute infarction in brainstem; b, focal infarction in olfactory bulb; c, micro-hemorrhage in cortex; d, dead and degenerating neurons (black arrows); eosinophilic neurons with neuronal shrinkage (blue arrow); and neuropil vacuolation (arrow head); micro-hemorrhage (yellow arrow). Scale bars for all panels are 100 μm. (D) T2-weighted MRI of brain from Tgfbr2Myeko mouse with signs of stroke (upper left panel), with hyperintensities (yellow arrows); H&E from same mouse in corresponding regions on MRI, (black arrows) showing loss of brain tissue. Lower subpanels, zoom. (E) Tgfbr2Myeko bone marrow causes stroke in wt mice, (n=13 for Tgfbr2Myeko donors, n=4 for wt donors). wt->wt denotes donor->recipient mice. (F) wt bone marrow rescues stroke in Tgfbr2Myeko mice (n=10 per group). For E-F, tick marks are censored subjects (alive at termination of experiment). **p<0.01, ***p<0.001