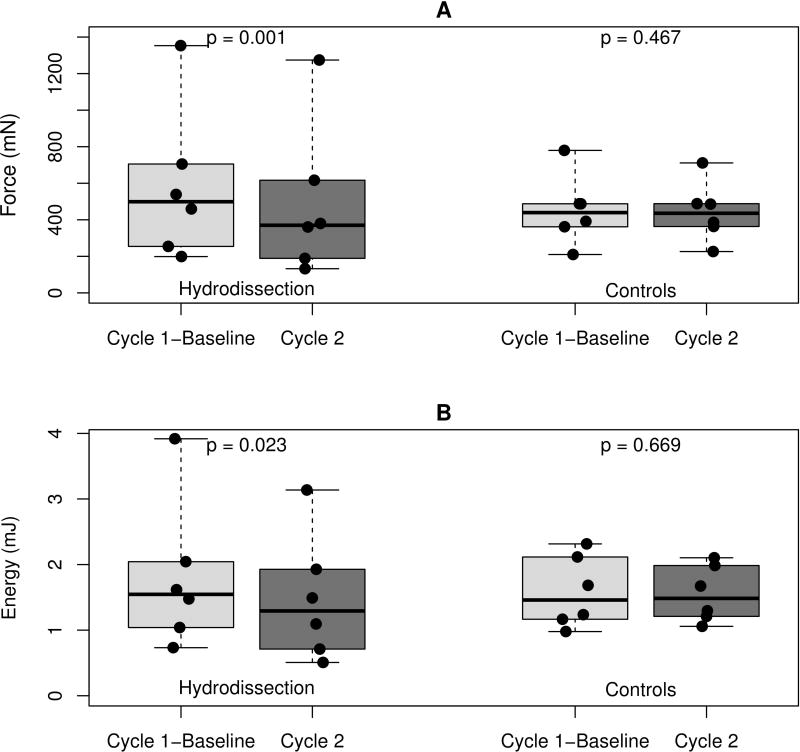
Figure 5.
Difference in A) peak gliding resistance and B) energy absorption between baseline (cycle 1) and second cycle for both groups. The boxplots show the distribution of peak gliding resistance and energy absorption for the two groups. The boxes represent the 25th, 50th, and 75th percentiles. The whiskers show the range and points represent the data values.

