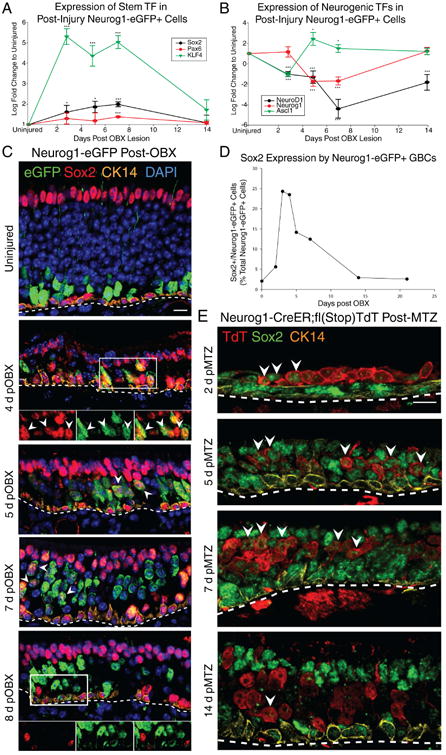
Figure 3. Expression Profiling of OSKM Reprogramming Factors and Other Likely Mediators.

(A) qRT-PCR of Sox2, KLF4 and Pax6 in FACS-isolated Neurog1+ GBCs as a function of survival time after OBX. (B) qRT-PCR of neurogenic transcription factors in the same samples. * p<0.05, *** p < 0.001, ANOVA. (C) IHC for Sox2, Neurog1-eGFP and CK14 as a function of time after bulbectomy. Arrowheads mark examples of eGFP+/Sox2+ cells. The scale bar equals 10 μm. (D) Counts of double positive Sox2+/Neurog1-eGFP+ cells by IHC, depicted as a percentage of all Neurog1-eGFP+ cells as a function of time after bulbectomy. (E) IHC for Sox2 following Neurog1-CreER-mediated lineage tracing as a function of time post-methimazole (MTZ) injury. The scale bar equals 10 μm. See also Figure S3
