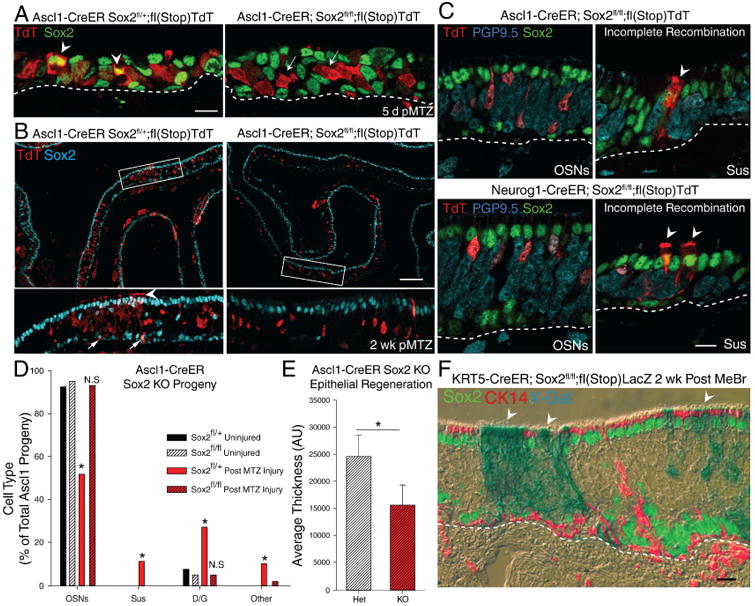
Figure 4. Sox2 is Required for Induced Multipotency.

IHC of Sox2 protein expression following Ascl1-CreER-driven Sox2 excision in mice that are either heterozygous or homozygous for the floxed Sox2 allele 5 days post-methimazole (MTZ). The arrowheads indicate TdT+/Sox2+ cells, while the arrows indicate TdT+/Sox2- cells. The scale bar represents 10 μm. Low-magnification image of Ascl1-CreER-driven excision in floxed Sox2 heterozygotes vs. homozygotes with lineage trace 2 weeks post-MTZ. The arrowhead marks Sus cells, the arrows mark self-renewed Sox2+ GBCs. The scale bar represents 100 μm. (C) High magnification of IHC of clones generated in the floxed Sox2 homozygous animals co-stained with Sox2. Arrowheads indicate Sus cells that failed to completely recombine and still express Sox2 demonstrating that recombination is occasionally incomplete. The scale bar represents 10 μm. (D) Counts of cell types generated in heterozygous vs homozygous floxed Sox2 mice (n = 3) after verifying Sox2 IHC negativity. * p < 0.05, Kruskal-Wallis ANOVA on Ranks. (E) Average tissue thickness 2 weeks after injury (n=3); * p < 0.001 two-tailed T-test. (F) IHC of K5-CreER-mediated Sox2 knockout and lineage trace post-injury, X-gal (blue in phase contrast) overlaid with fluorescent IHC for Sox2 (green) and CK14 (red). The scale bar equals 10 μm. See also Figure S4
